
Daily Stack 20250724
Heat Domes, Heat Risk, Climate Change & My Cooling Bill

“Extended bouts of great heat can result in more hospital visits, a sharp loss of productivity in construction and agriculture, reduced agricultural yields, and even direct damage to infrastructure,” points out Phys.org. - The World Economic Forum, 19 July 2022.

Downtown Manhattan during the June 2025 heatdome - Firetruck gets stuck in a sink hole when the pavement melts into it with temperatures reaching 96F, image from:
Yet Another Heat Dome This Summer 2025
Meteorologists are predicting another heat dome across much of North America as July ends and we move into August.
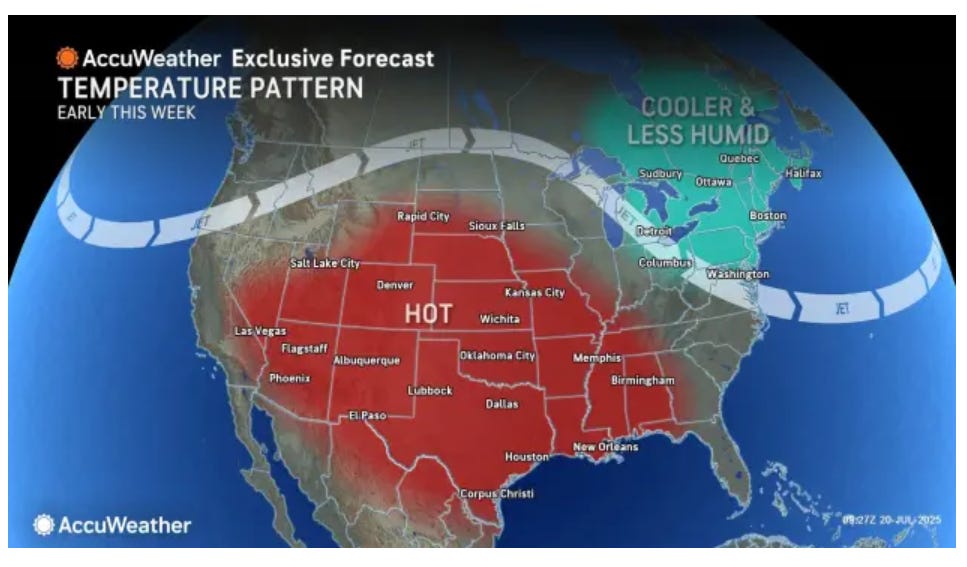
July 20, 2025 forecast by AccuWeather:
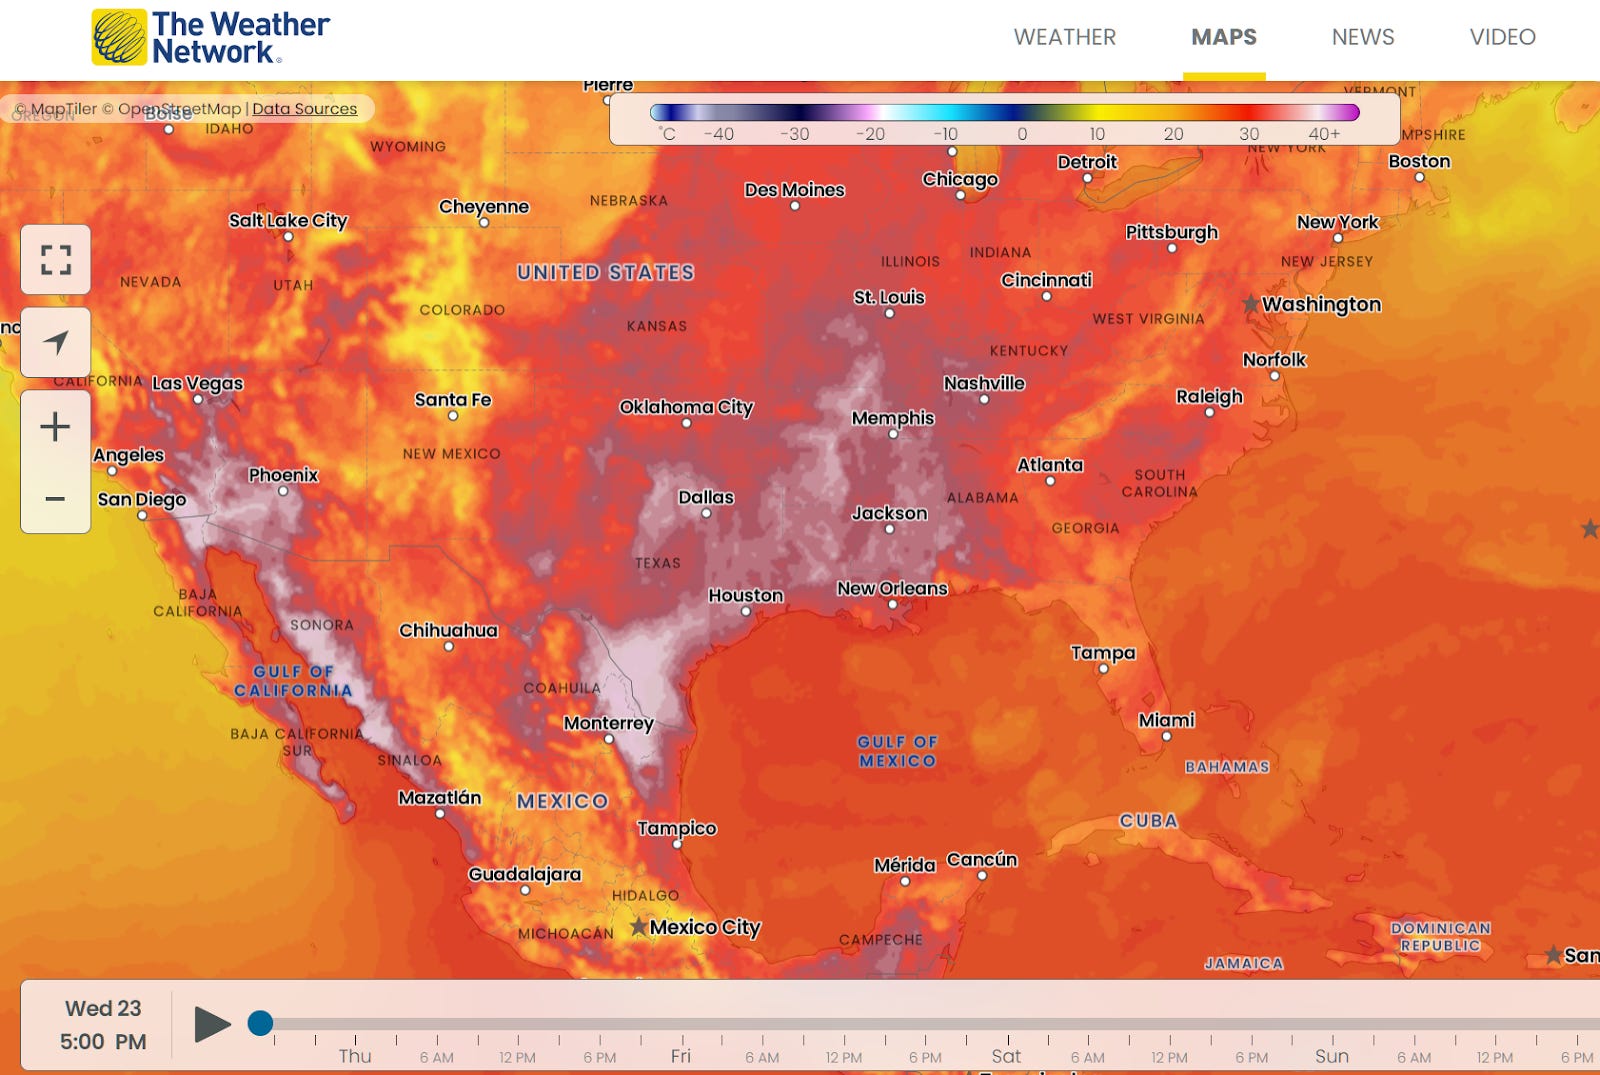
Temperatures ( °C) for Wednesday July 23, 2025 https://www.theweathernetwork.com/en/maps/temperature
So far this year there have been record breaking heatwaves across the northern hemisphere that included large regions of North America, Europe and Asia. In North America we experienced a deadly June heat dome. The same happened across Europe starting in May and peaking in June, with temperatures exceeding 40 °C. China is currently experiencing a severe heatwave that started in June causing spikes in energy demand and health risks.
What is concerning about these heat waves is their early start and prolonged nature.
What Causes Heat Domes
When the jet stream weakens, like an old river, it meanders causing it to bulge northwards (ridge) and southwards (trough) and its migration eastwards slows down. This allows warm tropical air from the south to move further north into the ridge. As air flows around the ridge it has a clockwise (anticyclonic) flow creating a high pressure area resulting in air pressing down to the earth’s surface. This compression further heats the already tropical air trapped in this ridge. Since sinking air suppresses cloud formation, the area of the ridge experiences clearer skies allowing more sunlight and energy to reach and heat the surface.
To either side of the ridge, there is usually a low pressure area associated with the trough. If the ridge-trough system deepens, these low and high pressure areas tend to get cut off - think of them like the area just before an oxbow lake is formed - these lows then block the high pressure area from moving eastwards causing it to persist for an extended period of time. This blocking phenomenon is called an Omega block because the shape is similar to the Greek letter Omega (𝛀).
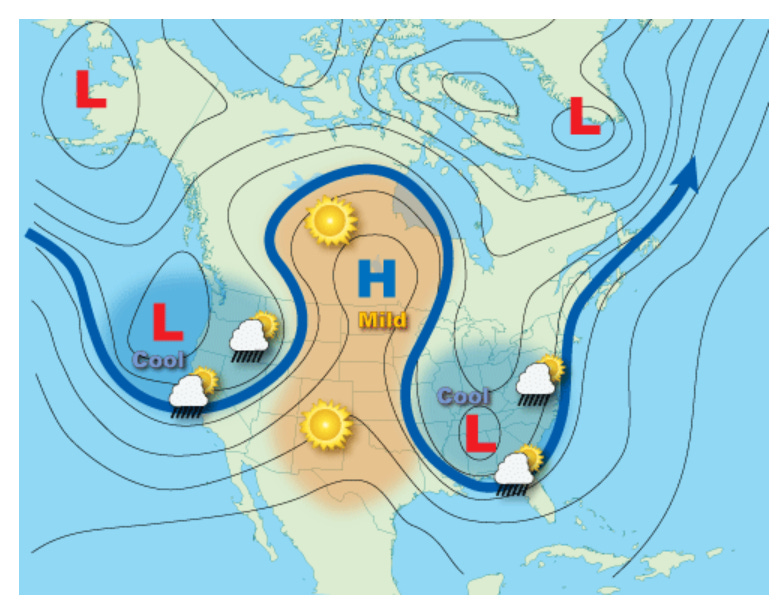
Omega block, https://www.noaa.gov/jetstream/upper-air-charts/basic-wave-patterns
Other factors now contribute to the intensity of the heat dome. Dark surfaces such as urban areas and exposed surfaces absorb the sun’s energy and radiate it back as heat. If the landscape is dry because there has been a lack of rain, this energy is converted completely into heat rather than used in evaporating water and cooling the area. Deserts are hotter because of the lack of moisture while oceans are cooler.
We now see the flip “summer” side of the polar vortex (which we wrote about in: https://bitsbytesclimatescience.substack.com/p/daily-stack-20250219) where hot air is intruding north and lingering for prolonged periods.
The Role of Climate Change
As discussed in our post on the polar vortex, with climate change and our rapidly warming world, the difference in temperature between the Arctic and mid-latitudes is weaker, and we have a weaker jet stream. This exacerbates the generally weaker jet stream that happens in the summer (compared to the winter jet stream).
A weaker jet stream flows slower, it gets wavier and can break. The bulge north (ridge) of the jet stream’s wave brings warmer tropical air further north causing much hotter conditions in that location than it used to be. As our climate changes, this will become more frequent and hazards associated with heat extremes will increase in frequency and severity. So essentially warming of air in the far north weakens the temperature differential between north and mid latitude regions. It is now unable to keep the hot tropical air in the tropics; it moves into the mid latitudes and further north; and is hotter than the air it displaces. Climate change will cause heat domes to happen further north and persist longer increasing its threat.
Climate change also increases the variability of our weather. Gone are the days of consistent and expected periods of hot, dry and wet weather. We now experience intense and longer hot and dry periods followed by torrential rain over a few hours, causing flash floods, followed by another prolonged intense hot and dry period.
To illustrate the changing frequency and intensity of heatwaves over the years caused by climate change, we present an analysis of the extreme daytime temperatures as an indicator of the intensity and frequency of heatwaves. The data we present was recorded at Austin TX and is similar to the analysis we showed in our previous post on the flooding in Kerr County (https://bitsbytesclimatescience.substack.com/p/daily-stack-20250706-flood-risk-update).
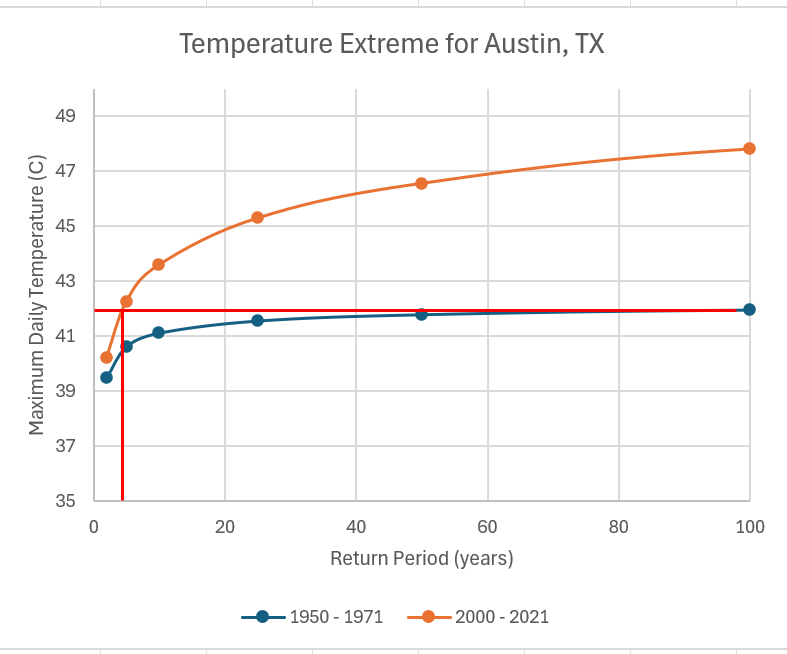
In the graph below, it shows the extreme daytime temperatures, Tmax, in degrees Celsius (°C), recorded over two 21-year periods: 1950 to 1971 (blue curve) and the more recent 2000 to 2021 (orange curve). There is a 29 year gap between the two periods. The x-axis is the Return Period in years. The return period can be thought of as the average time between events of a certain magnitude.
In the past 1950 to 1971, a 42 °C (107.5 °F) might happen at least once in 100 years. However, as our climate has changed, based on the recent data of 2000 to 2021, that temperature can now happen at least once in four and a half years (see the red lines where it intersects the orange curve and its associated Return Period axis). This is a 25 times increase in the frequency compared to the 1950 to 1971 period. We are experiencing temperatures like this fairly frequently these days.
The analysis we present compares the change in daily temperature extremes and their return periods over a 29 year gap. If the change remains the same, then a daytime temperature of 42 °C (107.5 °F) has a chance to increase in frequency by 25 times in the next 29 years. This literally means that it can happen every year. This poses a serious health and economic challenge to the Texas region.
Consequences
The consequence of a heat dome is extreme heat. This in turn causes heat related health hazards, drought, wildfires, threats to energy and food security, and pop-up thunderstorms with flash floods and its impact on people and property.
The increased energy demand for cooling will result in higher energy bills and if surge pricing occurs then this exacerbates the cost. For those who cannot afford such costs this poses a dangerous health risk.
Heat Is Deadly
Extreme heat is hazardous to health and can be deadly. Accuweather has reported that extreme heat is the deadliest weather hazard in the U.S. causing an average of 238 deaths per year over a 30-year period and last year 2024 it was reported that nearly 200 people died from heat related causes. And so far this year, Reuters has reported that about 2,300 people have died across European cities during the heatwave they experienced in June.
Heat Impacted Industries
The heat related health hazard impacts our ability to work outdoors. Industries that are most vulnerable are agriculture, forestry, energy and resource extraction, construction, utilities, sanitation, delivery, law enforcement, and emergency response.
Drought & Energy Security
With a heat dome and extreme heat, drought can happen if there has been a lack of rain prior to the occurrence of the heat dome. The extreme heat will cause more evaporation enhancing the drought conditions. Agriculture will be further impacted with extreme heat reducing yields and workers unable to timely harvest crops. Forests and brush will dry out which primes them for wildfires. Reservoirs and water sources will be warmer and lower, thus reducing our ability to produce electricity, industrial manufacturing and cooling including those for data centers and AI.
The need for cooling increases our energy demand which puts a strain on energy production. Transmission line efficiency degrades with increasing temperatures further degrading our energy security during these times. Brown outs and outages result. If transformers and substations fail then these need to be repaired which prolongs the outages. This can have serious consequences to health and safety services that rely on secure and reliable power.
Deadly Flash Floods
The extreme heat with increased humidity can create pop-up thunderstorms that can unleash large amounts of rain in a short time causing dangerous flash flooding. The deadly Texas floods came on the heels of the June heat dome. The humid air from the Gulf of Mexico fueled the thunderstorms which dumped more than a foot of water. Plus, the region was in drought and the soil was impermeable as pavement, resulting in the water to run off into the Guadalupe River to surge.
Look Up, Look Down, Look Around - What Can be Done to Prepare
Look up: We often have fair warning of about a week of an impending heat dome, its extreme heat and the health consequences. Weather reports and advisories are given of progressing heatwaves and any associated developing storms. If you have a favourite source for such information, please let us know and we will add to our resources page. However, for flash floods, while we may have warnings on how likely it might happen in a given area, we have very little warning when it is about to happen. In such cases be alert and err on the side of caution and move to higher ground.
Look Down: We can keep tabs on any weather forecast. We are then able to determine if the heat risk is high or low to be outdoors and to take the necessary precautions if it is unavoidable due to work or other commitments to be outdoors. These include hydration, cooling, taking breaks, and looking out for heat illness symptoms. These include: dizziness, headache, nausea, rapid pulse, and fatigue. Heat stroke is more severe with symptoms of confusion, slurred speech, and fever/high body temperature requiring immediate medical attention.
The same awareness can be said of any accompanying thunderstorm and flooding risk depending on your location. For example, if you are situated in a low lying area relative to the neighbouring areas your risk and exposure to flash floods may be high.
Look Around: A few of the things we need to think about are your neighbourhood, and health and safety. If your neighbourhood or where you work do not have trees or the city does not have an urban forest canopy, then less cooling and shade provided by the trees and higher temperatures. Rivers and lakes nearby also provide cooling through evaporation. However, their proximity means rivers and lakes can surge and flood if a flash flood happens. Be aware of your city’s or community’s cooling centres to seek shelter from the heat especially if you do not have air conditioning. Cooling centres can be libraries, shopping centres, community centres, and other municipal designated buildings. Take care of your kids, elderly and pets. Be prepared for brown outs and power outages - have your devices fully charged.
Adapting to Change
The buildings we work and live in were designed under historical building codes and standards that did not account for our increasing extremes in weather. These standards now need to be updated to reflect our current reality given our changing climate.
Our options are to upgrade or retrofit our existing buildings, adapting our behaviours when we cannot upgrade. New buildings should be built to standards that incorporate climate change projections to at least 50 years into the future.
For extreme heat, these would include but not limited to, improving thermal comfort of the building by improved insulation of walls and windows to keep the heat out and the cool in, add fans and air conditioning where possible, and apply passive measures such as green spaces rather than pavement. The following provides more detailed information.
BC Housing, Climate-Ready Housing Design Guide: https://www.bchousing.org/publications/Climate-Ready-Housing-Design-User-Guide.pdf
If you have any other sources related to updated building codes to adapt to climate change, please let us know and we will add them to our Resource section.
Increasing Cost: These adaptation measures to climate change plus the higher energy usage for cooling all result in higher costs for all. Without mitigation - the reduction of greenhouse gas emissions - we will continue to pay out while our personal incomes are limited. Poorer communities will be hit harder.
Resources:
World Economic Forum, Here’s how Heatwaves can Impact Economies, as well as People and Wildlife,
https://www.weforum.org/stories/2022/07/heat-waves-economy-climate-crisis/
Accuweather, Dangerous Heat Wave to Envelop 170 million Americans Through Late June:
Reuters, European Heatwave Caused 2,300 Deaths, Scientists Estimate:
Reuters, Record Heat in China Strains Power Grid, Stirs Health Fears:
Accuweather, Heat Exhaustion vs Heat Stroke, What are the Warning Signs and How Should You React:
Accuweather, 10-Tips to Stay Cool During a Heatwave:
https://www.accuweather.com/en/accuweather-ready/10-tips-to-stay-cool-during-a-heatwave/633332
Energy Digital, How do Heatwaves Affect Power Grids?
https://energydigital.com/news/climate-change-how-heatwaves-are-affecting-power-grids
Music:
George Clinton & the P-Funk All-Stars - Maggot Brain - Woodstock 99 (Official)
Thanks for reading Bits & Bytes of Climate Science! If you enjoyed this post, please click ♡ below, and help bits & bytes of climate science reach a wider audience.
Subscribe for free to receive new posts and support my work.
Bits & Bytes of Climate Science is free today. But if you enjoyed this post, you can tell Bits & Bytes of Climate Science that their writing is valuable by pledging a future subscription. You won't be charged unless they enable payments.