


KAYA FOR CORPORATIONS
Applying the Micro Kaya Identity to Google


Experiment Box
(main post begins below this grey box)

For those who are aural learners, Google’s NotebookLM was used to auto-generate a podcast from this post. All I submitted is the URL for this post. No additional “human instruction”. Enjoy.

https://notebooklm.google.com/notebook/fd56f781-e06a-4c0c-88b3-1527b46b8ceb/audio
WHY DECARBONIZE?
As a child in the 1960’s I was addicted to “How & Why” books. While I gravitated towards the HOW of things, the book series always subtly reminded its fans of the WHY behind the how.
(https://www.collectorville.net/index.php/ct-menu-item-7)
Why are we seeking to decarbonize the energy grid and the emissions and energy usage attributable to data centres. Why are we seeking to reduce the use of fossil fuels and/or replace them with renewables or nuclear power?
The US EPA’s Why is succinct:
“To address the growing climate crisis, and to meet the goal of net-zero GHG emissions economy-wide, we must eliminate nearly all greenhouse gas (GHG) emissions from the sector by 2050 and implement a holistic strategy to achieve a future mobility system that is clean, safe, secure, accessible, affordable, and equitable, and provides sustainable transportation options for people and goods”
(https://www.epa.gov/greenvehicles/why-we-need-decarbonize-transportation)
Natural Resources Canada’s Why is equally clear:
“The science of climate change is clear: the primary driver is greenhouse gas emissions from the production and combustion of fossil fuels.
Canada — and countries around the world — need to move aggressively to largely eliminate the unabated combustion of fossil fuels over the period between now and 2050”
The International Panel on Climate Change Why is even more succinct,
“The science shows that carbon dioxide remains the biggest driver of climate change, and that sustained cuts to GHG emissions would limit the impact of climate change. The path forward is clear: if we are to have a bright future on our planet, more companies must commit to robust decarbonization.”
The specific Hows towards decarbonization processes are many, depending on resources and technologies locally available, what is economically acceptable and equitable to all affected by the changes, and the constraints of maintaining systems.
Amongst these diverse Hows, as to methods and strategies, there is a common shared How:
How Do We Measure Progress Towards Decarbonization.
In the last post, “Kaya Variations” we extended the simple arithmetic of the Kaya Identity and a Decarbonization Interpretation System developed by Roger Pielke over multiple publications, so it can be applied to a wider set of use cases.
(https://bitsbytesclimatescience.substack.com/p/kaya-variations-decarbonization-math)
This post focuses on how the Kaya Identity can be applied to corporations based on basic financial and demographic information that is available for most publicly owned companies as well as on their emissions and energy usage information that is increasingly available in corporate sustainability reports.
WHY APPLY MICRO KAYA IDENTITY TO GOOGLE?
In 2020 Google’s CEO Sundar Pinchai echoed the above why’s with a focussed list of How’s . In the article, “Our Third Decade of Climate: Realizing a Carbon Free Future” he says
“The science is clear: The world must act now if we’re going to avert the worst consequences of climate change.
We are committed to doing our part. Sustainability has been a core value for us since Larry and Sergey founded Google two decades ago. We were the first major company to become carbon neutral in 2007. We were the first major company to match our energy use with 100 percent renewable energy in 2017. We operate the cleanest global cloud in the industry, and we’re the world’s largest corporate purchaser of renewable energy.
In our third decade of climate action, we are going even further to help build a carbon-free future for everyone. Here’s how:
We’re eliminating our entire carbon legacy, effective today.
We are the first major company to make a commitment to operate on 24/7 carbon-free energy in all our data centers and campuses worldwide. This is far more challenging than the traditional approach of matching energy usage with renewable energy, but we’re working to get this done by 2030.
We’re investing in technologies to help our partners and people all over the world make sustainable choices. For example, we are investing in manufacturing regions to enable 5 GW of new carbon-free energy, helping 500 cities reduce their carbon emissions and finding new ways to empower 1 billion people through our products.
We estimate that the commitments we’re making today will directly generate more than 20,000 new jobs in clean energy and associated industries, in America and around the world, by 2025.”
The video that accompanies Pinchai’s article is also well worth viewing.
(https://sustainability.google/operating-sustainably/net-zero-carbon/)
(https://sustainability.google/progress/energy/)
We can use the Micro Kaya Identity to track three of the four stated goals: Decarbonization towards eliminating carbon legacy, carbon free operation of data centres and the efficacy of new technologies in contributing towards Decarbonization. Pinchai’s final How around clean energy job creation is more a consequence (Outcome) of succeeding on the other three How’s.
SIMPLIFYING OUR METRICS
As a reminder from “Kaya Variations”

Decarbonization can be represented within the Micro Kaya identity as
CE/EA = TECH
Where CE/EA is the Decarbonization ratio, whose numerator CE isCarbon Emissions and whose denominator EA is Economic Activity
The Economic Activity (EA) term simplifies to the variable Market Cap (MC)
EA = EMP x MC/EMP = MC
and the Decarbonisation ratio CE/EA thus becomes CE/MC
TECH = TEC/MC x CE/TEC = CE/MC where TEC is Total Energy Consumption
As the Decarbonization ratio decreases, technologies are improving with respect to decarbonization, producing fewer emissions for the same amount of economic activity. As this ratio increases, technologies are declining with respect to decarbonization, creating more emissions for the same amount of economic activity.
MICRO KAYA EXAMPLE FOR GOOGLE
This example covers roughly the same ground of Robert Bryce’s excellent post on Google’s Net Zero Plans: (“Google’s Net Zero Plans Are Going Up in Smoke”)
(

)
We now approach it using the interpretation tools associated with the Kaya Identity. “Kaya Variations” drew upon an interpretation developed by Roger Pielke to compare decarbonization efforts of nations over time ; this post now applies it to the decarbonization efforts of companies over time (specifically, Google).
We source the data from several publicly available sources (Data transcribed 20241002 and double checked against screen shots taken that day)
Total Energy Consumption (TEC) and Carbon Emissions (CE) are sourced from the Google Environmental Reports of 2019 (covering years 2013 - 2018) and 2024 (covering years 2019 - 2023).
https://www.gstatic.com/gumdrop/sustainability/google-2019-environmental-report.pdf TEC from pg 60, key performance indicator (KPI) : “Total energy consumption”. CE from pg 59, key performance indicator (KPI) : “Greenhouse gas emissions” : “Total”
https://www.gstatic.com/gumdrop/sustainability/google-2024-environmental-report.pdf TEC from pg 76, key performance indicator (KPI): “Total energy consumption”. CE from page 75, key performance indicator, “Total emissions: Scope 1, 2 (market based) and 3 (total)”.
Employee Number (EMP) and Revenue are obtained from Statista
https://www.statista.com/statistics/273744/number-of-full-time-google-employees/
https://www.statista.com/statistics/266206/googles-annual-global-revenue/
End of year Market Cap (MC) was sourced from:
Based on those variables we calculate several ratios:
The Decarbonation Ratio (CE/MC) from the Micro Kaya Identity.
A trend comparator to CE/MC using revenue(REV) as the denominator (CE/REV). (https://www.investopedia.com/ask/answers/122414/what-difference-between-market-capitalization-and-revenue.asp#:~:text=Market%20capitalization%20and%20revenue%20are%20two%20metrics%20used%20for%20value,market%20cap%20but%20low%20revenues)
Emissions per Employee (CE/EMP)
Carbon Emissions per Total Energy Consumption (CE/TEC)
It is possible to calculate more simple ratios and even more complex ratios.We’ve settled on these simple ratios where CE is always the numerator and other aspects of a company are denominators. MC, REV, EMP track the economic growth of a company in different ways as it grows in share value, income, ability to provide employment.TEC tracks energy consumption of a company, as those processes are often the source of emissions. In an “ideal world” where growth is accompanied by increasingly efficient approaches to limiting carbon emissions, all of these ratios would tend to decrease
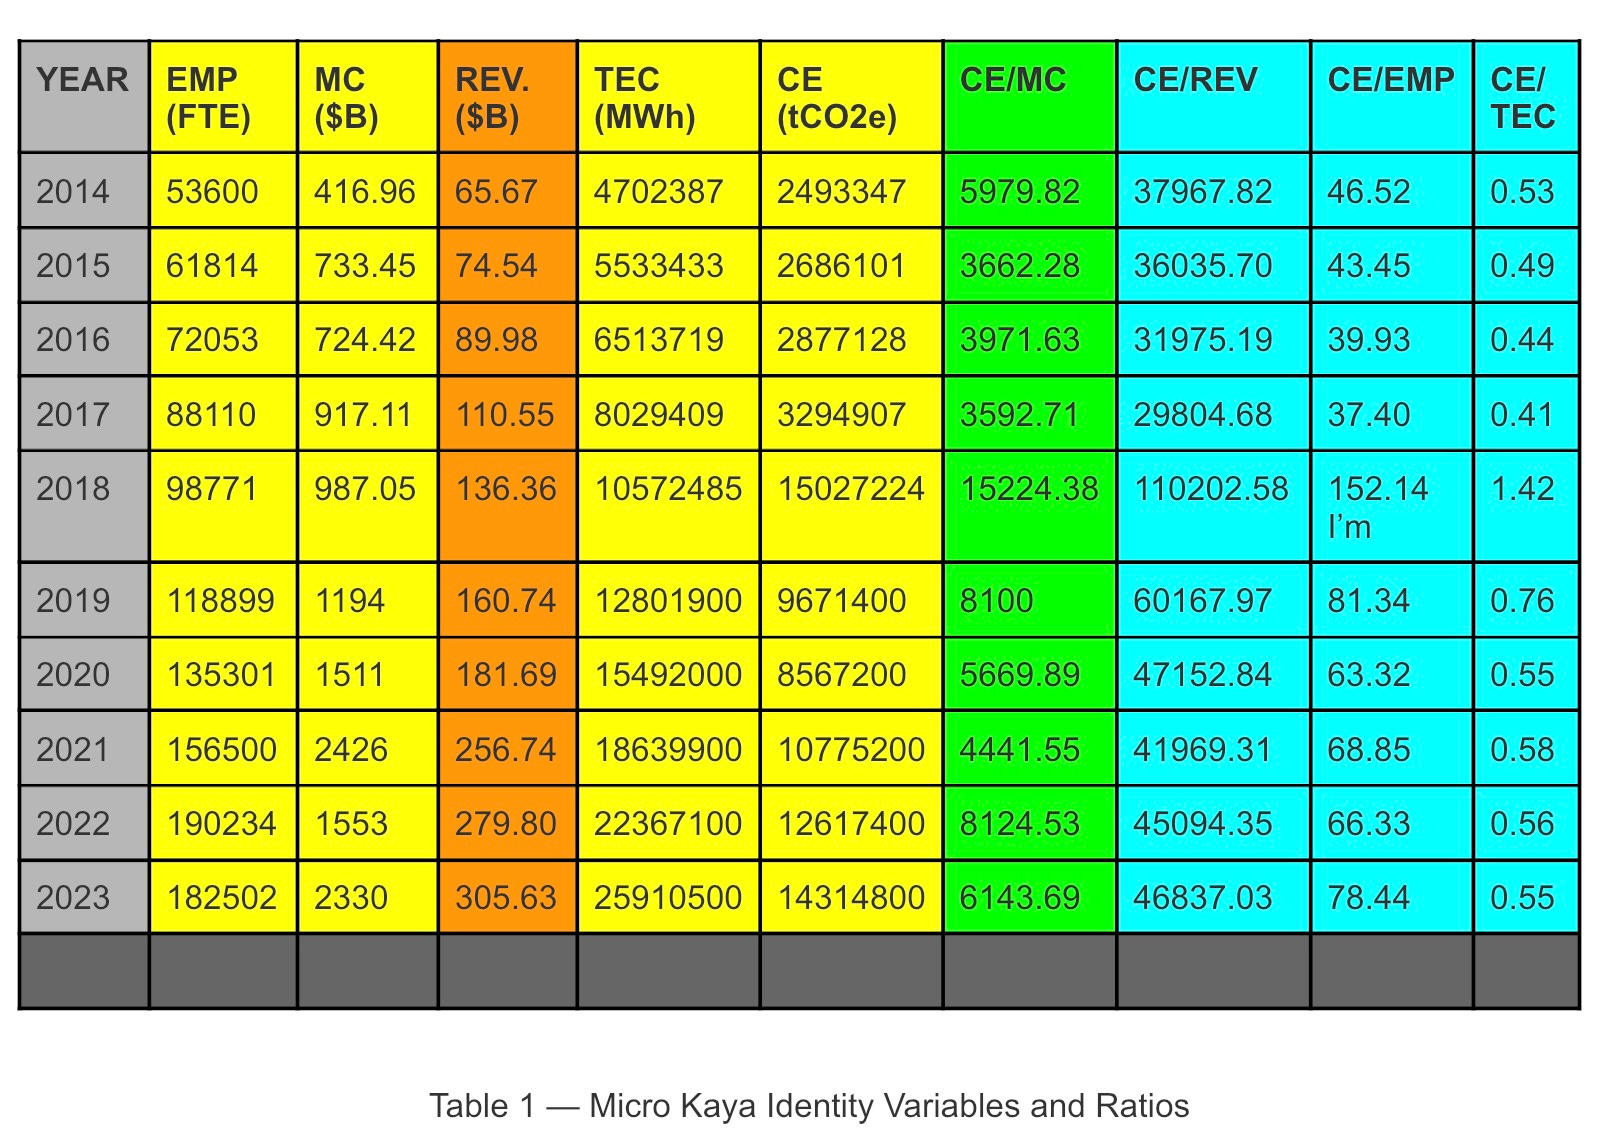
Based on this small set of KPI’s we summarize trends first in text, then graphically.
“RAW” VARIABLES
For the most part EMP, MC, REV, TEC, and CE are all rising over a decade, reflecting Google’s growth in value and its growing worldwide operations using more energy and creating more emissions.
2018 is a peak year for both energy usage and emissions.
RATIOS
CE/MC, the Decarbonization ratio shows no strong trend over a decade.
CE/REV, shows no strong trend over a decade, similar to CE/MC
CE/EMP, goes down from 2014 to 2017. Spikes in 2018. Bounces around 2019 to 2022, with a big jump in 2023 (Gen AI?).
CE/TEC, goes down 2014 to 2017. Spikes in 2018. Then continues going down 2019 to 2023. However, more recent 2019-2023 ratios are higher than in the earlier period 2014-2017.
Across ratios there are no strong trends of systematic decade long decarbonization or reduction of carbon emissions relative to financial values (MC, REV), employees, total energy usage. The strongest reduction trend is in CE/TEC which twice has a 4 year pattern of year to year reduction -- 2014 to 2017 and 2019 to 2023.
“RAW” VARIABLES


RATIOS


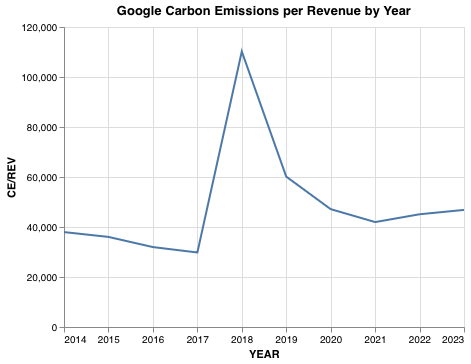

As the saying goes, “a picture is worth a 1000 words”. Plotting the data from Table 1 reiterates the trends obvious from scanning the individual tabulated values ; the trend of increase in the original “raw” data does not carry over to ratios where we may reasonably expect to see a trend of the common numerator (CE) decreasing relative to the other variables used in the denominator that reflect aspects of corporate growth. The ratios general shapes are very similar; only CE/TEC shows declines from 2021 to 2023.
While BOTH energy usage and emissions are increasing, there are no clear signs of decarbonization trends in their ratios; which we would expect if technological advances allow for the same amount of energy to be utilized with fewer emissions. As Bryce noted (based on somewhat different metrics) in “Google’s Net Zero Plans Are Going Up in Smoke”:
“Right now, it appears that Google and other Big Tech companies will see continuing increases in emissions until the U.S. and other countries get lots of new reactors built and online. That won’t happen quickly and it won’t be cheap. But Google’s emissions show that Big Tech doesn’t have many other choices.”
As (or If) Nuclear comes over the next few years as an option, we hope to see a stronger trend of these key ratios declining manifests itself. Power Purchase Agreements incorporating improving decarbonization, as well as more detailed monitoring approaches that allow more precise tracking of decarbonation on a daily basis and responsive mitigation may also help drive the Decarbonization and complementary ratios down.
(https://www.esgtoday.com/google-signs-435-mw-solar-ppa-to-power-u-s-operations/)
(https://www.sciencedirect.com/science/article/pii/S0306261921007595)
The view in the data table and plots above is focussed on an individual company; however each company summarized in this manner can be pro-rated to evaluate portfolios of companies from a Risk perspective using the techniques originally recommended by the Task Force on Climate-related Financial Disclosures, and subsequent updates.
(https://www.tcfdhub.org/Downloads/pdfs/E09%20-%20Carbon%20footprinting%20-%20metrics.pdf)
(https://assets.bbhub.io/company/sites/60/2020/10/FINAL-TCFD-Annex-Amended-121517.pdf)
(https://www.fsb-tcfd.org)
(https://www.ifrs.org/sustainability/tcfd/#)
(https://www.ifrs.org/content/dam/ifrs/supporting-implementation/ifrs-s2/ifrs-s2-comparison-tcfd-july2023.pdf)
THINKING ABOUT DECARBONIZATION & AI
The analysis above was relative to the totals of Google’s energy usage and emissions, rather than specifically focussed on data centres and AI which have been much in the news of late.
The 2024 Google Sustainability report devotes 5 pages (pp 9-13) to how AI aids sustainability; simple tracking and interpretation systems to monitor if AI is creating efficiencies or adding to carbon load are needed to track progress (or lack thereof) towards sustainability. Google’s recent sustainability reports highly detailed appendices do break out data centre growth in places, but do not (as far as I can tell) break out the AI component of that growth and its associated energy usage and emissions production.
The Kaya Identity, and the interpretation system developed around it, can help. There is a simple test. With systemic decarbonization, the Decarbonization ratio CE/MC tied to AI should decrease and the sum of CE and TEC tied to AI specific operations must be less than CE & TEC reductions due to AI for total corporate energy consumption and emission outputs
If not; AI is a net contributor (or neutral) to emissions and to energy usage.
These 3 rules below define whether AI is improving efficiency of energy usage and contributing to carbon reduction:
1. CE/MC due to AI is decreasing so that CE/MC (last year) > CE/MC ( this year).
2. CE (AI) < CE decline in corporate Totals that are due a
3. TEC (AI) < TEC decline in corporate Totals that are due to AI.
These 3 inequalities have to be satisfied to demonstrate AI is effectively using information to more effectively optimize limited energy resources and reduce carbon emissions contributing to climate change.
Via the interpretation framework provided by the Kaya Identity we have now operationalized the concepts and arguments in:
(https://open.substack.com/pub/bitsbytesclimatescience/p/the-renewable-energy-transition-latticework?r=7bwi2&utm_medium=ios)
that connect Climate Change, AI, and the current grid evolution towards renewables asca means of reducing fossil fuel emissions.
The high level reporting changes required are towards identifying the component of AI contributions to TEC and CE and the proportion of MC attributable to AI. Google has identified three levers to manage the environmental effects of AI in its 2024 Sustainability Report (pg 13): model optimization, infrastructure, emission reductions. These strategies can individually and in concert reduce our AI footprint on energy and emissions. But they are still producing emissions and using energy. Can we demonstrate that the emissions they produce are balanced by a greater loss in total emissions due to predictions and optimizations; or utilizing additional information they enable outside of their own AI operations? Can we demonstrate the energy used by AI provides greater energy reductions elsewhere?
NEXT UP
Where to next? In future posts we will continue to roll up and examine how the Micro Kaya Identity can be used to develop financial multipliers associated with decarbonization. We will also roll down to examine how Statistical Process Control (SPC) techniques applied to emissions monitoring can be used to daily “steer” and course correct towards our annual and longer term decarbonization goals. We will also look at how we can build on SPC and develop AI techniques on emission sensor networks to identify fugitive emissions.
By now we should be clear on the “Whys”. Future posts will delve into the “How’s” of monitoring and assessing progress in Decarbonization efforts.
Stay tuned
If you would like to help work out methodology based on the Kaya Identity Variations -- feel free to drop us a line directly or in comments/notes in Bits and Bytes of Climate Science and start a conversation.
Image modified from: https://en.wikipedia.org/wiki/How_and_Why_Wonder_Books#/media/File:How_and_Why_Wonder_Books.jpg
Subscribe for free to receive new posts and support my work
On the Autogenerated Podcast in Experiment Box
I am currently playing with Google’s NotebookLM to autogenerate podcasts from posts. People have different ways of absorbing information. The posts focus on words,numbers, and simple data visualizations. The autogenerated podcasts are for people who learn by listening. NotebookLM’s podcast capability conversational, simulates a pair of podcast ears (one female, one male) doing a “deep dive” on the text of the post. It does not cover every last word. Nor is it in the sequential order of the post. Rather it is a simulated conversation, at times taking tangents from the text; occasionally to my surprise adding material that was not in my text but was consistent with it. There is a bit of laughter, even jokes.
Here is the podcast for this post, “Kaya for Corporations”. All I submitted is the URL for this post. No additional “human instruction”.
https://notebooklm.google.com/notebook/fd56f781-e06a-4c0c-88b3-1527b46b8ceb/audio
As a comparison to this expository, here is an autogenerated podcast from my Haiku blog on a very different topic, the traces trauma leaves
https://notebooklm.google.com/notebook/49fd0fa1-eeb3-46e9-9d22-3e0426ebd68e/audio
based on the Haiku from:
https://open.substack.com/pub/haikuscience/p/lookback-2014?r=7bwi2&utm_campaign=post&utm_medium=web
a record from one of the toughest years for my family as almost biweekly my daughter was hospitalized and often fighting for her life, while her twin brother was distraught and my wife and I transformed from parents to EMTs. Knowing it was a simulation, and having a good idea what was under the hood as a data scientist; I still found myself reacting very emotionally, in tears at times.
Finally, here is an autogenerated podcast from my Product Innovation AI blog on Team Dynamics (Flow Teams), which takes a more descriptive (“soft skills”) approach to elucidating the team dynamics challenges of AI product teams.
https://notebooklm.google.com/notebook/8867fb14-33e5-4248-a826-27aac91771a2/audio
based on the text from
https://open.substack.com/pub/productinnovationai/p/let-us-flow?r=7bwi2&utm_campaign=post&utm_medium=web
Even in its current experimental stage Google’s NotebookLM technology surprises with its ability to be an audio replicant, if not quite passing the Turing test. The male and female podcast AI have distinct voices; through Google Scholar they do a good job following up references and hints in the main text. Mistakes of transcription and interpretation are made for sure — but no deal breakers yet. And they make jokes I never had in my post (which I now wish I did). They do a credible job across three posts that are structured very differently. Across multiple podcasts the argument structure built into the generation system does appear. But it also appears in my favourite podcasts Pod Save America & Pivot with Kara Swisher; based on success patterns for conversations. These podcasts are not quite up to the level of my two favourite podcasts ; BUT they are better than many podcasts I have heard. Perhaps the Google team behind NotebookLM’s podcast capability will add in awkward silence and malaprop’s for a more authentic human simulation. Already the technology is strong at artificially emulating empathy. We’ve come a long way since Eliza
(https://psych.fullerton.edu/mbirnbaum/psych101/eliza.htm)
(https://en.wikipedia.org/wiki/ELIZA)
Given the theme of this post on energy, emissions and AI — I have to wonder:
How much energy was used and how much carbon was emitted generating the audio. Oh, the AI are talking about that right now. I’d better go give it a listen. ;-)
If you want to try NotebookLM out, the URL is below:
https://notebooklm.google